Ethereum's price surge has slowed down slowly, but there is still hope of exceeding $3000With the recent surge in Ethereum pausing, investors cannot help but ask: When will Ethereum prices resume rising? From the charts and recent headlines, we can glimpse some possible future scenarios.Firstly, Ethereum's chart shows that after a significant increase, prices have recently experienced a pullback and the market has taken a breather
Ethereum's price surge has slowed down slowly, but there is still hope of exceeding $3000

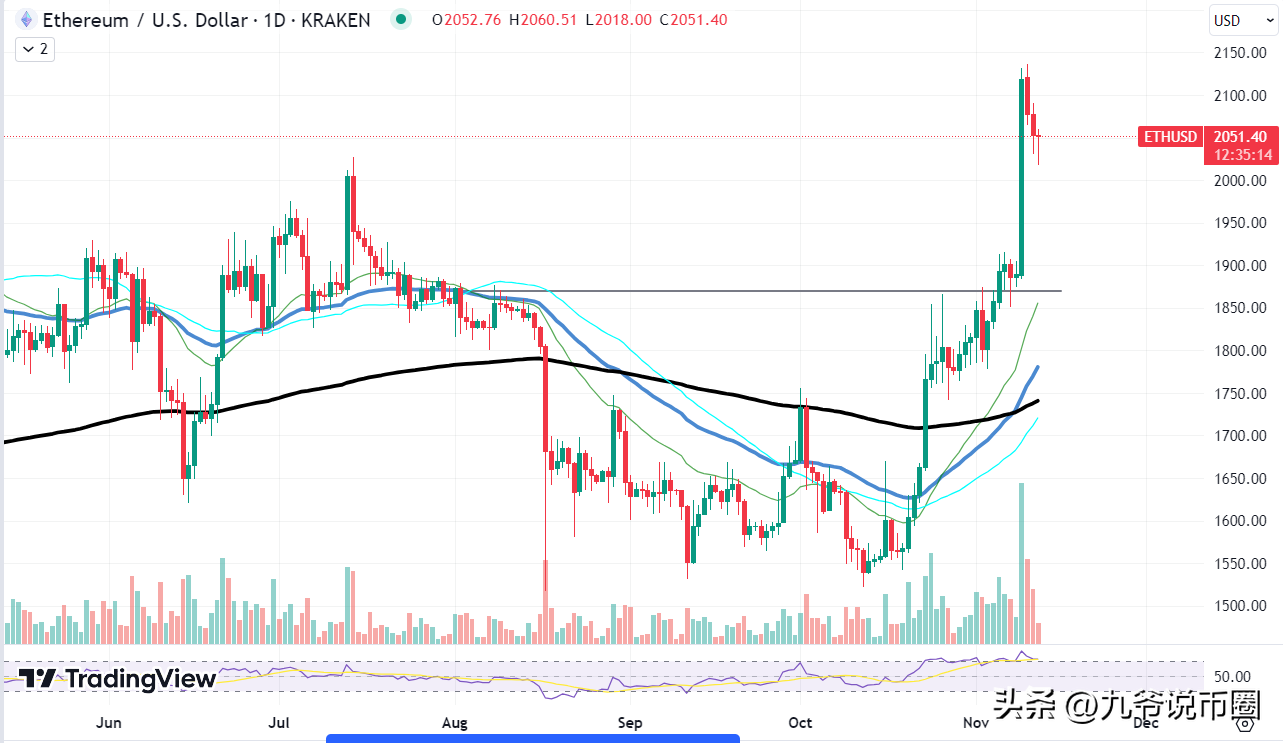
With the recent surge in Ethereum pausing, investors cannot help but ask: When will Ethereum prices resume rising? From the charts and recent headlines, we can glimpse some possible future scenarios.
Firstly, Ethereum's chart shows that after a significant increase, prices have recently experienced a pullback and the market has taken a breather. This consolidation stage is healthy as it allows the market to establish new support levels. In addition, Ethereum's prices are still far above its 50 day and 100 day moving averages, indicating that the overall trend is still bullish.
The relative strength index (RSI) has fallen from overbought levels, which may provide space for prices to rise again. Considering these factors, we can see that the price of Ethereum may rebound in the short term.
Bullish scenario
Ethereum is currently facing critical support challenges. If Ethereum can maintain its current support level and avoid falling below the critical moving average, then prices may rise again. This increase may be driven by an increase in market adoption and positive sentiment.
At present, the Bollinger band is narrowing, which is an important signal. The Bollinger band is usually used to measure changes in price momentum, and when it begins to narrow, it usually means that the market is approaching an important turning point. If Ethereum can successfully break through the Bollinger Belt on track, it may mark the beginning of another bullish phase.
Bearish scenario
Recent data shows that the destruction rate of Ethereum has reached stable growth and exceeded emissions six months after the merger and upgrade, leading to deflation. However, the daily destruction rate of Ethereum recently hit a 7-month low on March 12th, with a decrease of over 89% since its historical high. This dynamic may have an impact on the supply and demand economy, which in turn may affect the prices of Ethereum.
Investors should note that a continuous decrease in the destruction rate may lead to a decrease in supply, and if demand remains stable or increases, this may indicate a prospect of price increases. However, at the same time, there is also uncertainty in the market's perception of Ethereum. On the contrary, falling below the moving average may indicate a bearish reversal. The increase in selling pressure and negative market sentiment may further lower prices. The bearish cross of MACD further confirms this, indicating that it may be time to prepare for a potential downward trend.
However, the deflationary trend of Ethereum is still ongoing, despite the current decline in destruction rates. Therefore, investors need to pay attention to the continued trend of net consumption. If demand remains stable or increases, this may lead to a decrease in supply and price increases in the future.
Chaigou joins the team
Recently, the price trend of ShibaInu (SHIB) has become a focus of attention. As the craze for meme coins continues, people are discussing whether it can break the $0.00001 threshold this week. Deep technical research is crucial for evaluating the potential of this cryptocurrency.
Analyzing the price chart of SHIB, we observed a significant increase in its value, and the token is challenging previous resistance levels. The moving average convergence divergence (MACD) shows a positive trend, with the blue MACD line much higher than the signal line, indicating a strong upward trend. The Relative Strength Index (RSI), although not in the overbought region, is approaching the 70 level upward, which may indicate increased buying pressure.

It is worth noting that a key factor is breaking through the 50 day and 100 day moving averages, and SHIB has surpassed this moving average, indicating a strong upward trend. The trading volume column is consistent with the price increase, further confirming the bullish stance of traders. In addition, the Bollinger Line is expanding, which usually means increased market volatility and the possibility of significant price fluctuations.
For ShibaInu, the psychological threshold of $0.00001 is already within reach. In order to continue to break through this level, SHIB needs to maintain its current momentum and see a continuous influx of purchases. If the price can close above this level on the daily chart, it may confirm a bullish breakthrough and may lead to further increases.
The recent SHIB transfer of Coin An has undoubtedly intensified the market speculation frenzy. Such large-scale transfers may indicate institutional interest or important traders building positions, which in turn may lead to significant price fluctuations. At present, SHIB's technical setup looks very promising, with the possibility of reaching and exceeding the $0.00001 threshold.
However, investors should remain cautious. Meme coins may be highly volatile and sensitive to market sentiment. The key to determining whether SHIB can maintain its upward trajectory is to closely monitor the above technical indicators and the news of large transfers. Although we are optimistic about the future potential of SHIB, we must recognize the risks of this cryptocurrency and the possibility that it may not meet expectations. Therefore, investors should make decisions based on their risk tolerance and investment goals.
That's all for today's article. If you like it, you can follow it~
The market is constantly changing, or if you want to join the newspaper group for heating, please feel free to leave a message at any time.
Thank you for watching. Please like, follow, and see you next time!
Disclaimer: The content of this article is sourced from the internet. The copyright of the text, images, and other materials belongs to the original author. The platform reprints the materials for the purpose of conveying more information. The content of the article is for reference and learning only, and should not be used for commercial purposes. If it infringes on your legitimate rights and interests, please contact us promptly and we will handle it as soon as possible! We respect copyright and are committed to protecting it. Thank you for sharing.(Email:[email protected])
